CAMBRIDGE, Mass. — GE Vernova Inc. (NYSE: GEV), a unique industry leader enabling customers to accelerate the energy transition, today reported financial results for the second quarter ending June 30, 2024.
“GE Vernova delivered another strong quarter with EBITDA margin expansion across all segments and substantial cash improvement,” said GE Vernova CEO Scott Strazik. “Global electrification and decarbonization trends continue to drive demand for our products and services, and we are delivering value for our stakeholders. Our lean operating model is focused on improving safety, quality, delivery and cost as we execute for our customers and innovate breakthrough energy transition technologies. Given our strong first half performance and momentum in our Power and Electrification segments, we are raising our full-year 2024 guidance.”
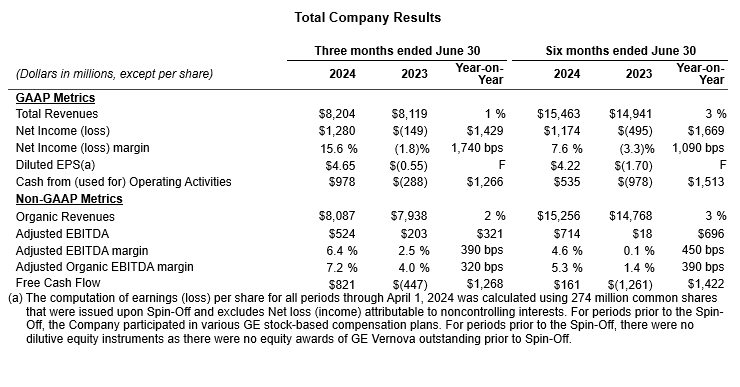
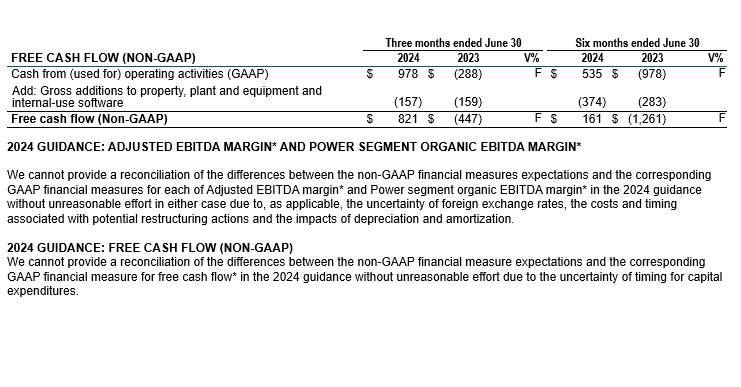
In the second quarter, GE Vernova orders of $11.8 billion decreased (7)% organically, primarily due to a large Offshore Wind equipment order in the second quarter of last year that was canceled in the fourth quarter. Services orders increased double-digits, led by Power and Electrification. Revenue of $8.2 billion was up +1%, +2% organically*, driven by continued strength in Electrification and Power and positive price in all three segments. Services revenue grew +7%, +9% organically*, with growth across all segments. Margins expanded by more than 300 basis points from productivity, price and services volume. Cash flow improved by more than $1.0 billion, sequentially and year-over-year, driven by working capital and adjusted EBITDA* growth.
Power
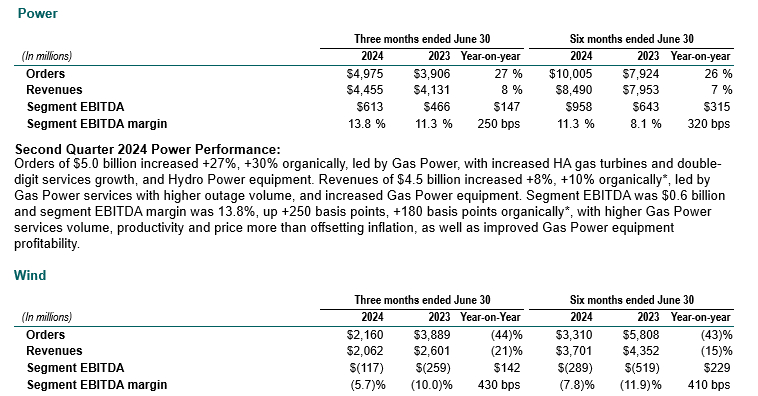
- Orders of $5.0 billion increased +30% organically from Gas Power and Hydro Power equipment and double-digit services order growth. Revenues of $4.5 billion increased +8%, +10% organically*, led by higher Gas Power services and equipment.
- Commissioned its one hundredth HA gas turbine, part of the fastest growing fleet in the H-Class segment with the highest number of units ordered, bringing its global installed H-Class capacity to more than 53 gigawatts.
Wind
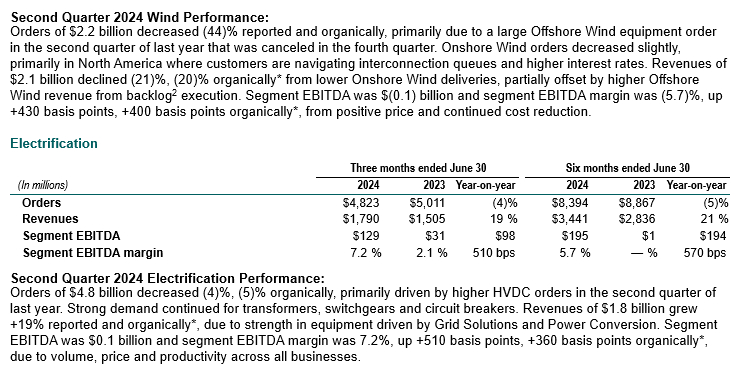
- Orders of $2.2 billion decreased (44)% organically, primarily driven by the large Offshore Wind order in the second quarter of last year and slightly lower Onshore Wind orders. Revenues of $2.1 billion decreased (21)%, (20)% organically*, from lower Onshore Wind deliveries, partially offset by Offshore Wind backlog[1] execution.
- Booked 1.8GW of wind turbine orders, including repowering, while continuing to implement selectivity, lean and pricing.
Electrification
- Backlog1 grew 35% year-over-year on orders of $4.8 billion, which decreased (5)% organically, primarily driven by higher High-Voltage Direct Current (HVDC) orders in the second quarter of last year. Revenues of $1.8 billion increased +19% reported and organically*, with strength in Grid Solutions and Power Conversion equipment.
- Secured a major order from Sonelgaz, through the GE Algeria Turbines (GEAT) joint venture, for high voltage grid equipment and solutions for 134 substations in Algeria by 2028.
Company Updates:
In the second quarter of 2024, GE Vernova:
- Experienced two fatalities and updated its Life Saving Rules as fatality-free operations remain a top priority.
- Completed the sale of part of its Steam Power nuclear activities to Electricité de France S.A. (EDF). In connection with the disposition, we received net cash proceeds of $0.6 billion, subject to customary working capital and other post-close adjustments. As a result, GE Vernova recognized a pre-tax gain of $0.9 billion.
- Invested $0.2 billion in capital expenditures to prepare for outages and increase capacity in Power and Electrification.
- Funded $0.2 billion in research and development (R&D) spending to continue advancing breakthrough energy transition technologies.
- Received approximately $0.3 billion, related to an outcome of an arbitration with a multiemployer pension plan (the Fund) that remains in dispute.
“We’re very encouraged by our first half results as we execute on our strategy to deliver disciplined revenue growth with increased profitability and positive cash generation. Strong working capital management and higher EBITDA drove significant cash improvement in the second quarter. Based on our performance, we are now trending towards the higher end of our revenue guidance for 2024 and have increased our expectations for adjusted EBITDA margins and free cash flow,” said GE Vernova CFO Ken Parks. “We remain focused on strategic capital allocation and are committed to maintaining our investment-grade balance sheet.”
Guidance:
GE Vernova is raising its 2024 financial guidance and now expects revenue to trend towards the higher end of $34-$35 billion and adjusted EBITDA margin* of 5%-7%, up from the higher end of mid-single digits. Additionally, GE Vernova now expects free cash flow* of $1.3-$1.7 billion, up from $0.7-$1.1 billion. Segment guidance is:
- Power: mid-single digit organic revenue* growth and ~150-200 basis points of organic EBITDA margin* expansion, up from ~100 basis points.
- Wind: flat organic revenue* growth, approaching profitability.
- Electrification: mid- to high-teen organic revenue* growth, up from low double-digits, and high single-digit EBITDA margin, up from mid-single digits.
Results by Reporting Segment
The following segment discussions and variance explanations are intended to reflect management’s view of the relevant comparisons of financial results.
Non-GAAP Financial Measures
The non-GAAP financial measures presented in this press release are supplemental measures of our performance and our liquidity that we believe help investors understand our financial condition and operating results and assess our future prospects. We believe that presenting these non-GAAP financial measures, in addition to the corresponding U.S. GAAP financial measures, are important supplemental measures that exclude non-cash or other items that may not be indicative of or are unrelated to our core operating results and the overall health of our company. We believe that these non-GAAP financial measures provide investors greater transparency to the information used by management for its operational decision-making and allow investors to see our results “through the eyes of management.” We further believe that providing this information assists our investors in understanding our operating performance and the methodology used by management to evaluate and measure such performance. When read in conjunction with our U.S. GAAP results, these non-GAAP financial measures provide a baseline for analyzing trends in our underlying businesses and can be used by management as one basis for financial, operational and planning decisions. Finally, these measures are often used by analysts and other interested parties to evaluate companies in our industry.
Management recognizes that these non-GAAP financial measures have limitations, including that they may be calculated differently by other companies or may be used under different circumstances or for different purposes, thereby affecting their comparability from company to company. In order to compensate for these and the other limitations discussed below, management does not consider these measures in isolation from or as alternatives to the comparable financial measures determined in accordance with U.S. GAAP. Readers should review the reconciliations below and should not rely on any single financial measure to evaluate our business. The reasons we use these non-GAAP financial measures and the reconciliations to their most directly comparable GAAP financial measures follow. Unless otherwise noted, tables are presented in U.S. dollars in millions, except for per-share amounts which are presented in U.S. dollars. Certain columns and rows within tables may not add due to the use of rounded numbers. Percentages presented in this report are calculated from the underlying numbers in millions.
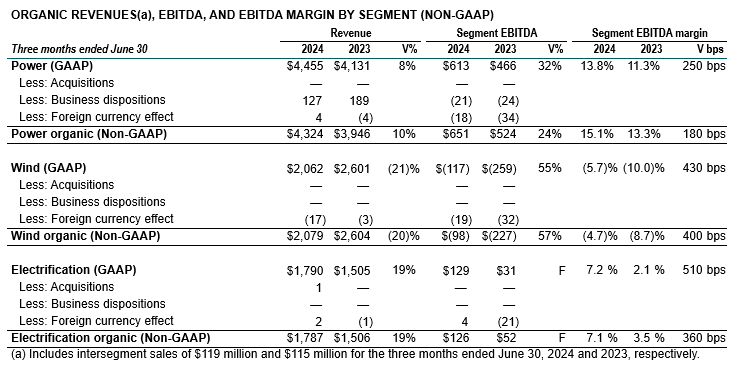
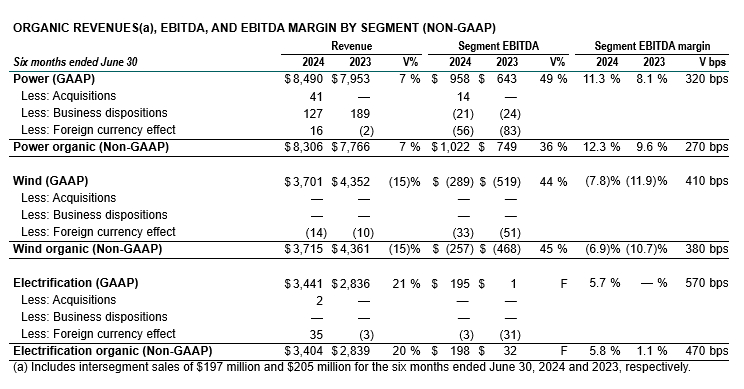
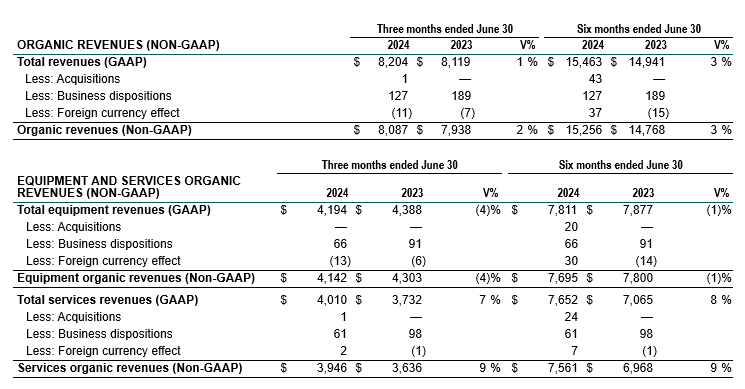
We believe the organic measures presented below provide management and investors with a more complete understanding of underlying operating results and trends of established, ongoing operations by excluding the effect of acquisitions, dispositions and foreign currency, which includes translational and transactional impacts, as these activities can obscure underlying trends.
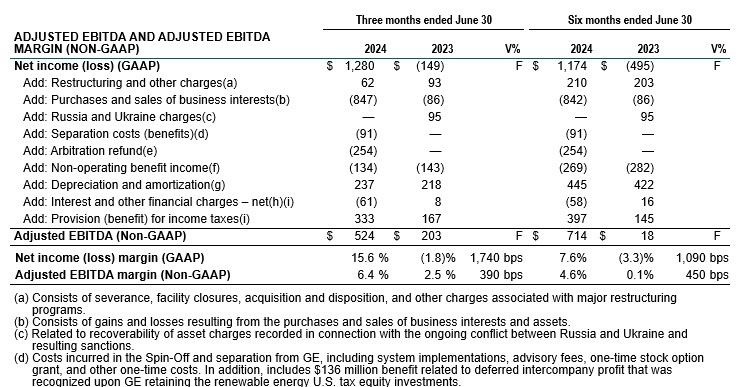
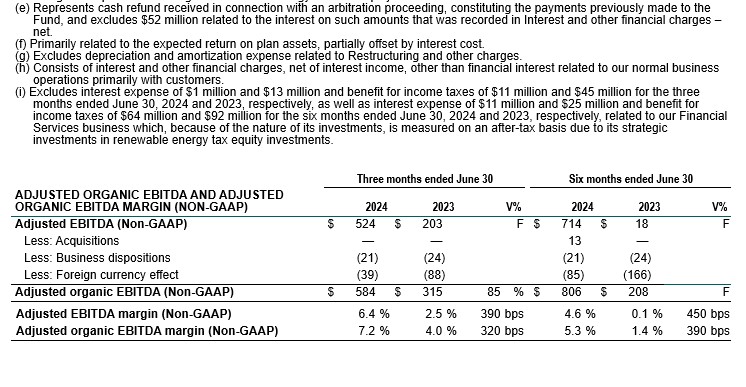
We believe that Adjusted EBITDA* and Adjusted EBITDA margin*, which are adjusted to exclude the effects of unique and/or non-cash items that are not closely associated with ongoing operations provide management and investors with meaningful measures of our performance that increase the period-to-period comparability by highlighting the results from ongoing operations and the underlying profitability factors. We believe Adjusted organic EBITDA* and Adjusted organic EBITDA margin* provide management and investors with, when considered with Adjusted EBITDA* and Adjusted EBITDA margin*, a more complete understanding of underlying operating results and trends of established, ongoing operations by further excluding the effect of acquisitions, dispositions and foreign currency, which includes translational and transactional impacts, as these activities can obscure underlying trends.
We believe these measures provide additional insight into how our businesses are performing, on a normalized basis. However, Adjusted EBITDA*, Adjusted organic EBITDA*, Adjusted EBITDA margin* and Adjusted organic EBITDA margin* should not be construed as inferring that our future results will be unaffected by the items for which the measures adjust.
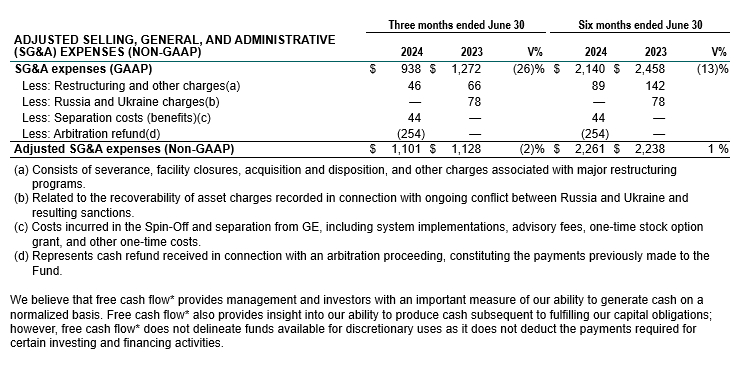
We believe Adjusted selling, general, and administrative expenses* provides investors with improved comparability of underlying operating results and a further understanding and additional transparency regarding how we evaluate our business. Adjusted selling, general, and administrative expenses* also provides management and investors with additional perspective regarding the impact of certain significant items on our expenses. Adjusted selling, general, and administrative expenses* excludes unique and/or non-cash items that can have a material impact on our results. However, Adjusted selling, general, and administrative expenses* should not be construed as inferring that our future results will be unaffected by the items for which the measure adjusts.
*Non-GAAP Financial Measure
[1] Defined as remaining performance obligation (RPO)


